

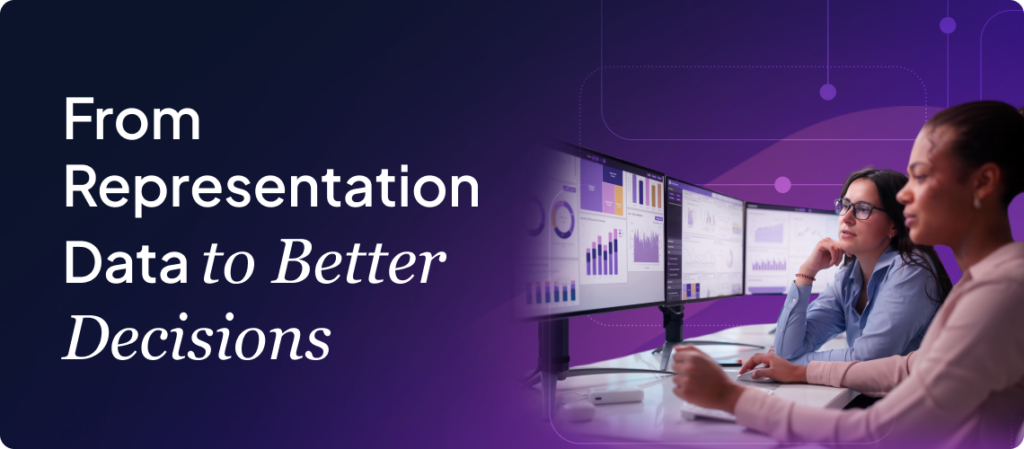
The Representation Dashboard began as an initiative of the Women Advisory Board at Teads, a forum that meets monthly to examine the situation of women across the organization and identify opportunities for meaningful action.
The need to look beyond headline figures is particularly relevant in ad tech. Women represent only around 25% of the technology workforce and 11% of executive roles, according to IAB Tech Lab. Broader workplace research also shows that for every 100 men promoted to manager, only 93 women are promoted, a gap that can compound at every subsequent career level. At Teads, our overall workforce is broadly gender-balanced, with close to 50% representation of women. Yet our dashboard shows that this balance is not reflected equally across all managerial levels. This is why looking at the total workforce is not enough: we also need to understand progression, identify where gaps emerge, and use that evidence to guide more focused decisions.
Over six months, Bouchra Khal, Caroline Hugonenc, and Alejandra Herrera worked together to turn that need into a practical tool. By combining data expertise, organizational context, and the perspective of the Women Advisory Board, they developed a dashboard that is now helping colleagues at Teads generate insights and have more evidence-based conversations about representation.
Looking beyond a snapshot
Knowing the percentage of women in an organization is useful, but it does not tell the whole story.
A single number cannot explain how we arrived at our current position, whether representation is improving, or whether changes are being driven by hiring, promotions, retention, or organizational restructuring.
The Representation Dashboard connects these different dimensions and helps answer three key questions:
Where are we today?
The dashboard provides a consolidated view of representation across business areas and organizational levels, including management and leadership.
How is representation changing?
By tracking hiring, promotions, and retention over time, it helps us distinguish temporary fluctuations from more meaningful trends.
How do we compare externally?
Relevant market benchmarks add context, helping us understand how our position relates to broader industry patterns and where closer attention may be needed.
Building a more complete picture
No single metric can fully explain workforce representation.
For example, the percentage of women in leadership becomes more meaningful when compared with the percentage of women in the overall workforce. The dashboard’s Equity Gap Index captures this relationship, helping us assess whether women are progressing into management in proportion to their presence within the organization.
The dashboard also brings together indicators such as:
- Representation across workforce and management levels
- Gaps between organizational levels
- Hiring, promotion, and retention trends
- Progress over time and comparison with external benchmarks
Together, these measures help us move from simply observing an outcome to better understanding the dynamics behind it.
For the Women Advisory Board, this creates a stronger foundation for asking the right questions: Where are we making sustainable progress? Where might barriers remain? And where could focused action have the greatest impact?
Using data responsibly
The dashboard is built on clear privacy principles. Demographic information is voluntarily self-reported, no assumptions are made about employees who choose not to disclose it, and results are presented only in aggregate.
The data must also be interpreted with care. Participation rates can vary across teams, while reorganizations, department changes, and reporting structures can affect historical comparisons. Being transparent about these limitations is essential to producing insights that colleagues can trust.
A foundation for action
The Representation Dashboard is not intended to be another static report or a scorecard viewed in isolation. It is a decision-support tool.
By creating a shared and consistent view of representation, it can help the Women Advisory Board and other stakeholders identify areas that deserve further attention, direct initiatives more intentionally, and monitor whether actions are contributing to meaningful change.
The project also demonstrates the value of collaboration. Combining analytical expertise with organizational knowledge and the lived perspective represented by the Women Advisory Board helped ensure that the dashboard was both rigorous and relevant.
Better data will not create change on its own. But it can give us a common understanding of where we are, help us decide where to focus, and strengthen our collective responsibility for where we go next.